Case study · 8 min read · 30-second summary below
Autodesk ACC
In six weeks, in a field none of us knew, we turned 25,000 comments into one problem and designed a way to trace every clash back to the change that caused it.
The 30-second version
- The problem
- Construction teams can see what changed in a building model and what broke, but not how the two connect, so they match them up by hand.
- What I did
- Led a team of four, new to construction, through a 6-week sprint. We narrowed 25,000+ public comments to one problem, with AI for the first pass and people checking every code.
- What I proposed
- Two core ideas: a change timeline inside each clash, and clash forecasting.
- What we designed
- Sketches, paper prototypes and wireframes that link every clash to its change, cut the noise with filters, and warn before clashes happen.
- Where it stands
- Not tested with end users. Reviewed on paper with the team and a colleague who used to work at Autodesk.
This was an industry project with Autodesk. In line with the University of Lancashire’s dissemination guidance, materials supplied by Autodesk, the findings from stakeholder and customer interviews, and product-specific detail aren’t shared here. The visuals are our own work, made generic.
- Client
- Autodesk Construction CloudIndustry project, MSc UX, University of Lancashire
- Timeline
- 6-week sprintAgile Scrum: Discovery, Ideation, Evaluation
- Methods
- Heuristic evaluation, benchmarkingThematic analysis, sketching, paper prototyping, wireframing
- My role
- Team lead and designer, team of four
- Proposed the two core ideas: a change timeline inside each clash, and clash forecasting.
- Framed the problem statement and How Might We questions.
- Did the thematic analysis and analysed the interview excerpts.
- Leading
- Scrum, stand-ups, stakeholder callsMade sure everyone spoke, and prepared the final presentation
- 25K+
- Public comments from forums, social media, YouTube and Reddit
- 160
- Useful insights after AI-assisted and hand-checked filtering
- 2
- Core ideas: a change timeline inside each clash, and forecasting
- Untested
- Not with end users. Reviewed on paper with the team and a colleague who used to work at Autodesk.
The statement
Construction teams can see what changed in a building model, and what broke. They can’t see how the two connect.
- What changedChange Analysis: objects added, removed or modified between versions.
- What brokeClash Analysis: objects that overlap and must be fixed before building.
- The missing linkTwo separate tools, so people match them up by hand.
01 · The brief
Two tools that should be one
Construction teams build a 3D model of a building before anyone builds the real thing. Autodesk Construction Cloud has two ways to check those models, and they live in completely different places.
Tracks every object in the model across versions: what moved, who moved it and when.
Finds places where two objects take up the same space, like a pipe running through a beam. Every clash has to be fixed before the building can be built.
In real work, the two belong together. When someone finds a clash, the first thing they want to know is which change caused it. And fixing a clash means making another change, so the brief asked: could the product suggest that change, or record it against the clash as history?
The brief asked for two levels of work: workflow design (when and where to show clash and change analysis, and to which users) and UI design (how the two sets of results work together on screen). We worked on both.
02 · Getting up to speed
Learning a new field, fast
None of us had worked in construction. Before we could design anything, we had to understand how the tools behave and where they let people down.
An inconsistent interface and limited feedback make it hard to connect model changes with clashes, follow them over time, and move between the two workflows. It was also unclear who made a change, where it came from, and who should fix the problem.
Direct competitors such as Revizto, Trimble Connect, BIMcollab and Procore. And tools that handle the same kind of problem elsewhere: Git, Google Docs, Microsoft 365 and Figma. Each of those tracks who changed what, and when.
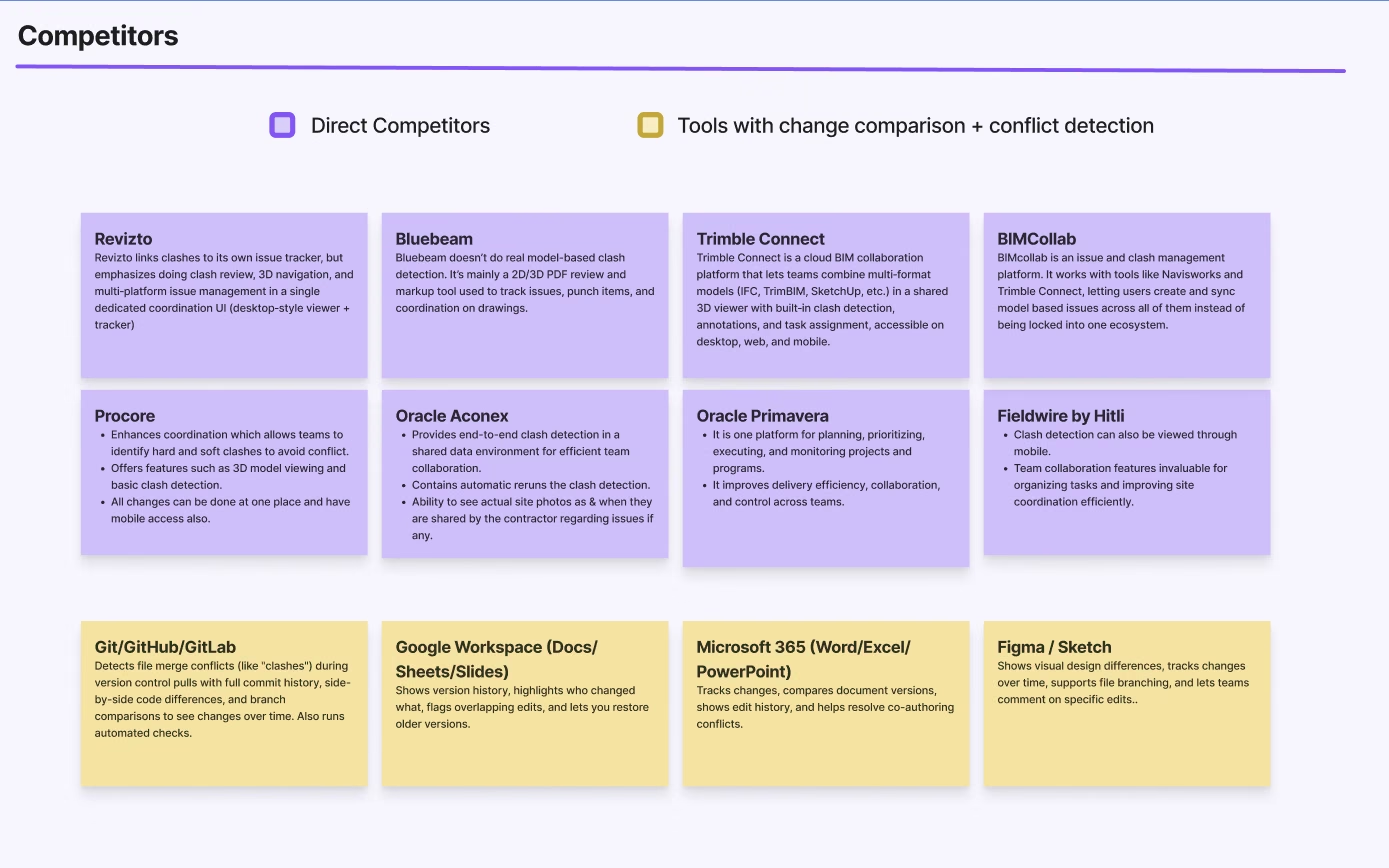
The pattern we borrowed
Navisworks tracks clashes through a clear status lifecycle, from New through to Resolved, so teams share one view of what’s been dealt with. That gave us a pattern to learn from instead of designing clash tracking from scratch.
03 · The problem
25,000 comments, one problem
Autodesk gave us background data and excerpts from stakeholder and customer interviews, which aren’t shared here. To hear from a wider group of users, we collected over 25,000 public comments about ACC, clash and change analysis, model coordination and Navisworks.
- 25,000+Public comments
- 160Useful insights
- 5Themes
- 2Main themes
- 1Problem
AI to narrow, people to judge
- What we discovered
Reading 25,000 comments line by line wasn’t possible in six weeks.
- What we decided
Let AI do the first pass, flagging which comments were worth coding.
- What we did
AI made mistakes naming codes, so we checked and agreed every code by hand, then filtered again in Excel. We set the codes and themes ourselves.
- What it cost
The first filter shaped what we saw. I’d want to check what it left out.
- Positives
- Pain Points and Frustrations
- Manual Workarounds
- Workflow Challenges
- Visibility Gaps
The problem in one sentence
There’s no link between what changed and what broke.
So teams can’t tell what caused a new clash. They match things up by hand, which means more missed issues, slower reviews, and no clear record of who decided what. We turned the themes into How Might We questions, ranked them by impact and frequency, and turned the top ones into a MoSCoW list of requirements.
Trace a clash back to the change that caused it, in one place instead of two tools.
Make long lists of clashes easier to sort and review.
Help teams see clashes coming, not just find them afterwards.
Save how each clash was fixed, and show it when a similar clash comes up again.
04 · On paper
First ideas on paper
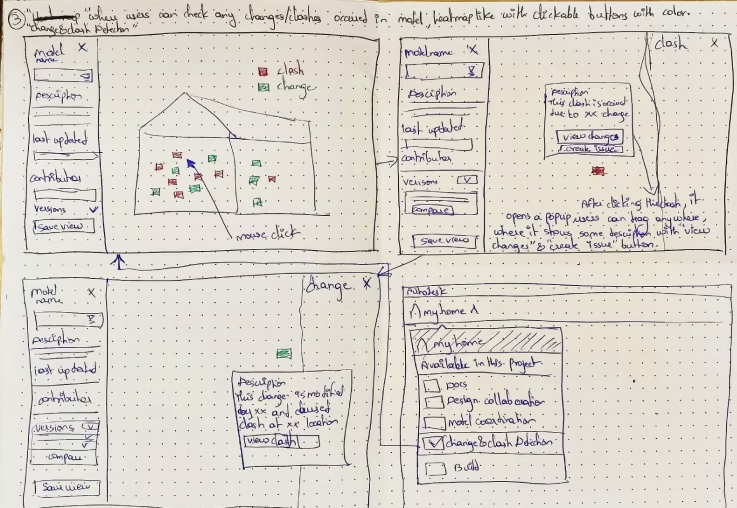
We sketched before we designed anything on screen. The first sketch put both kinds of analysis on one 3D model, with clashes and changes shown as coloured markers. Click a clash and it tells you which change caused it, with buttons to view that change or create an issue. Click a change and it tells you which clash it caused.
The link we were looking for worked in both directions, even on paper.
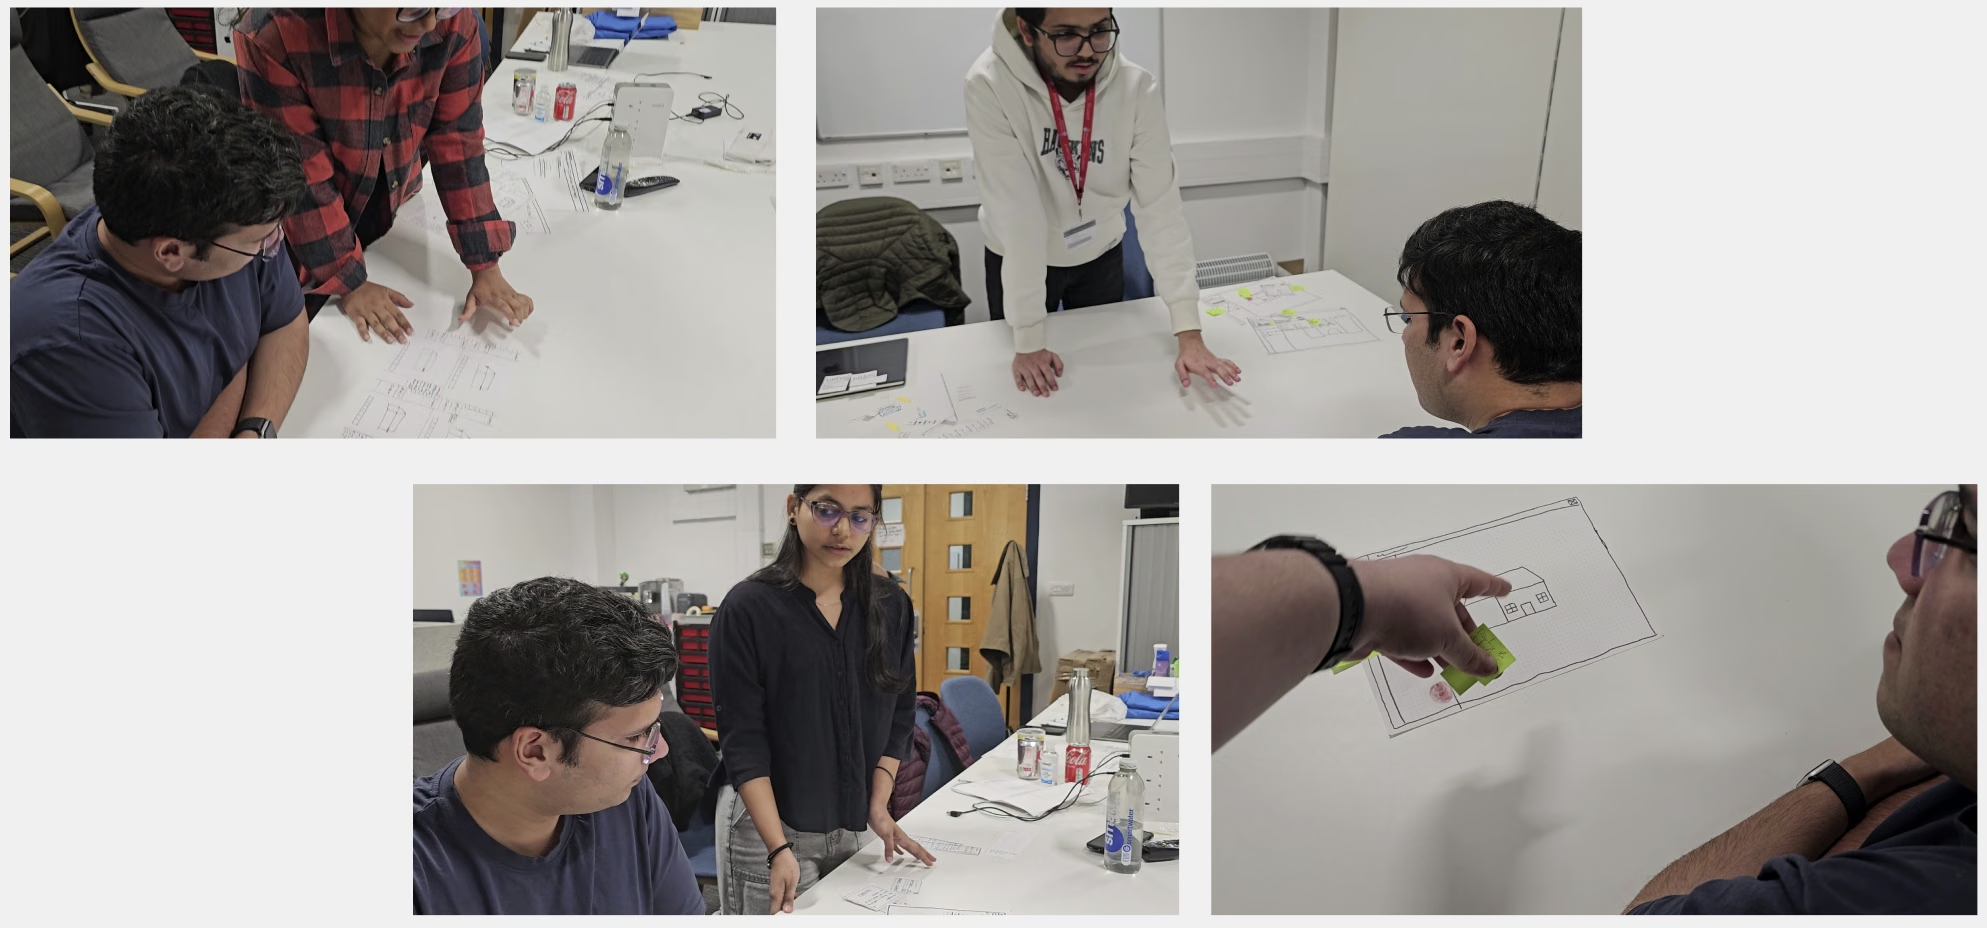
We tested the paper screens in sessions with the team and a colleague who used to work at Autodesk, walking through clash scenarios by hand. Three decisions came out of this stage.
05 · Decision 1
Put the change history inside the clash
- What we discovered
People couldn’t tell who made a change, where it came from, or who should fix the clash. And users want to trace a clash back to its cause.
- What I proposed
Don’t send people to another tool. Show the change history right where the clash is.
- What we designed
Open a clash and see both objects side by side, each with its own timeline of changes, ending at the change that caused the clash.
- What it means for the user
They can see who changed what and when, and contact the right team straight away.
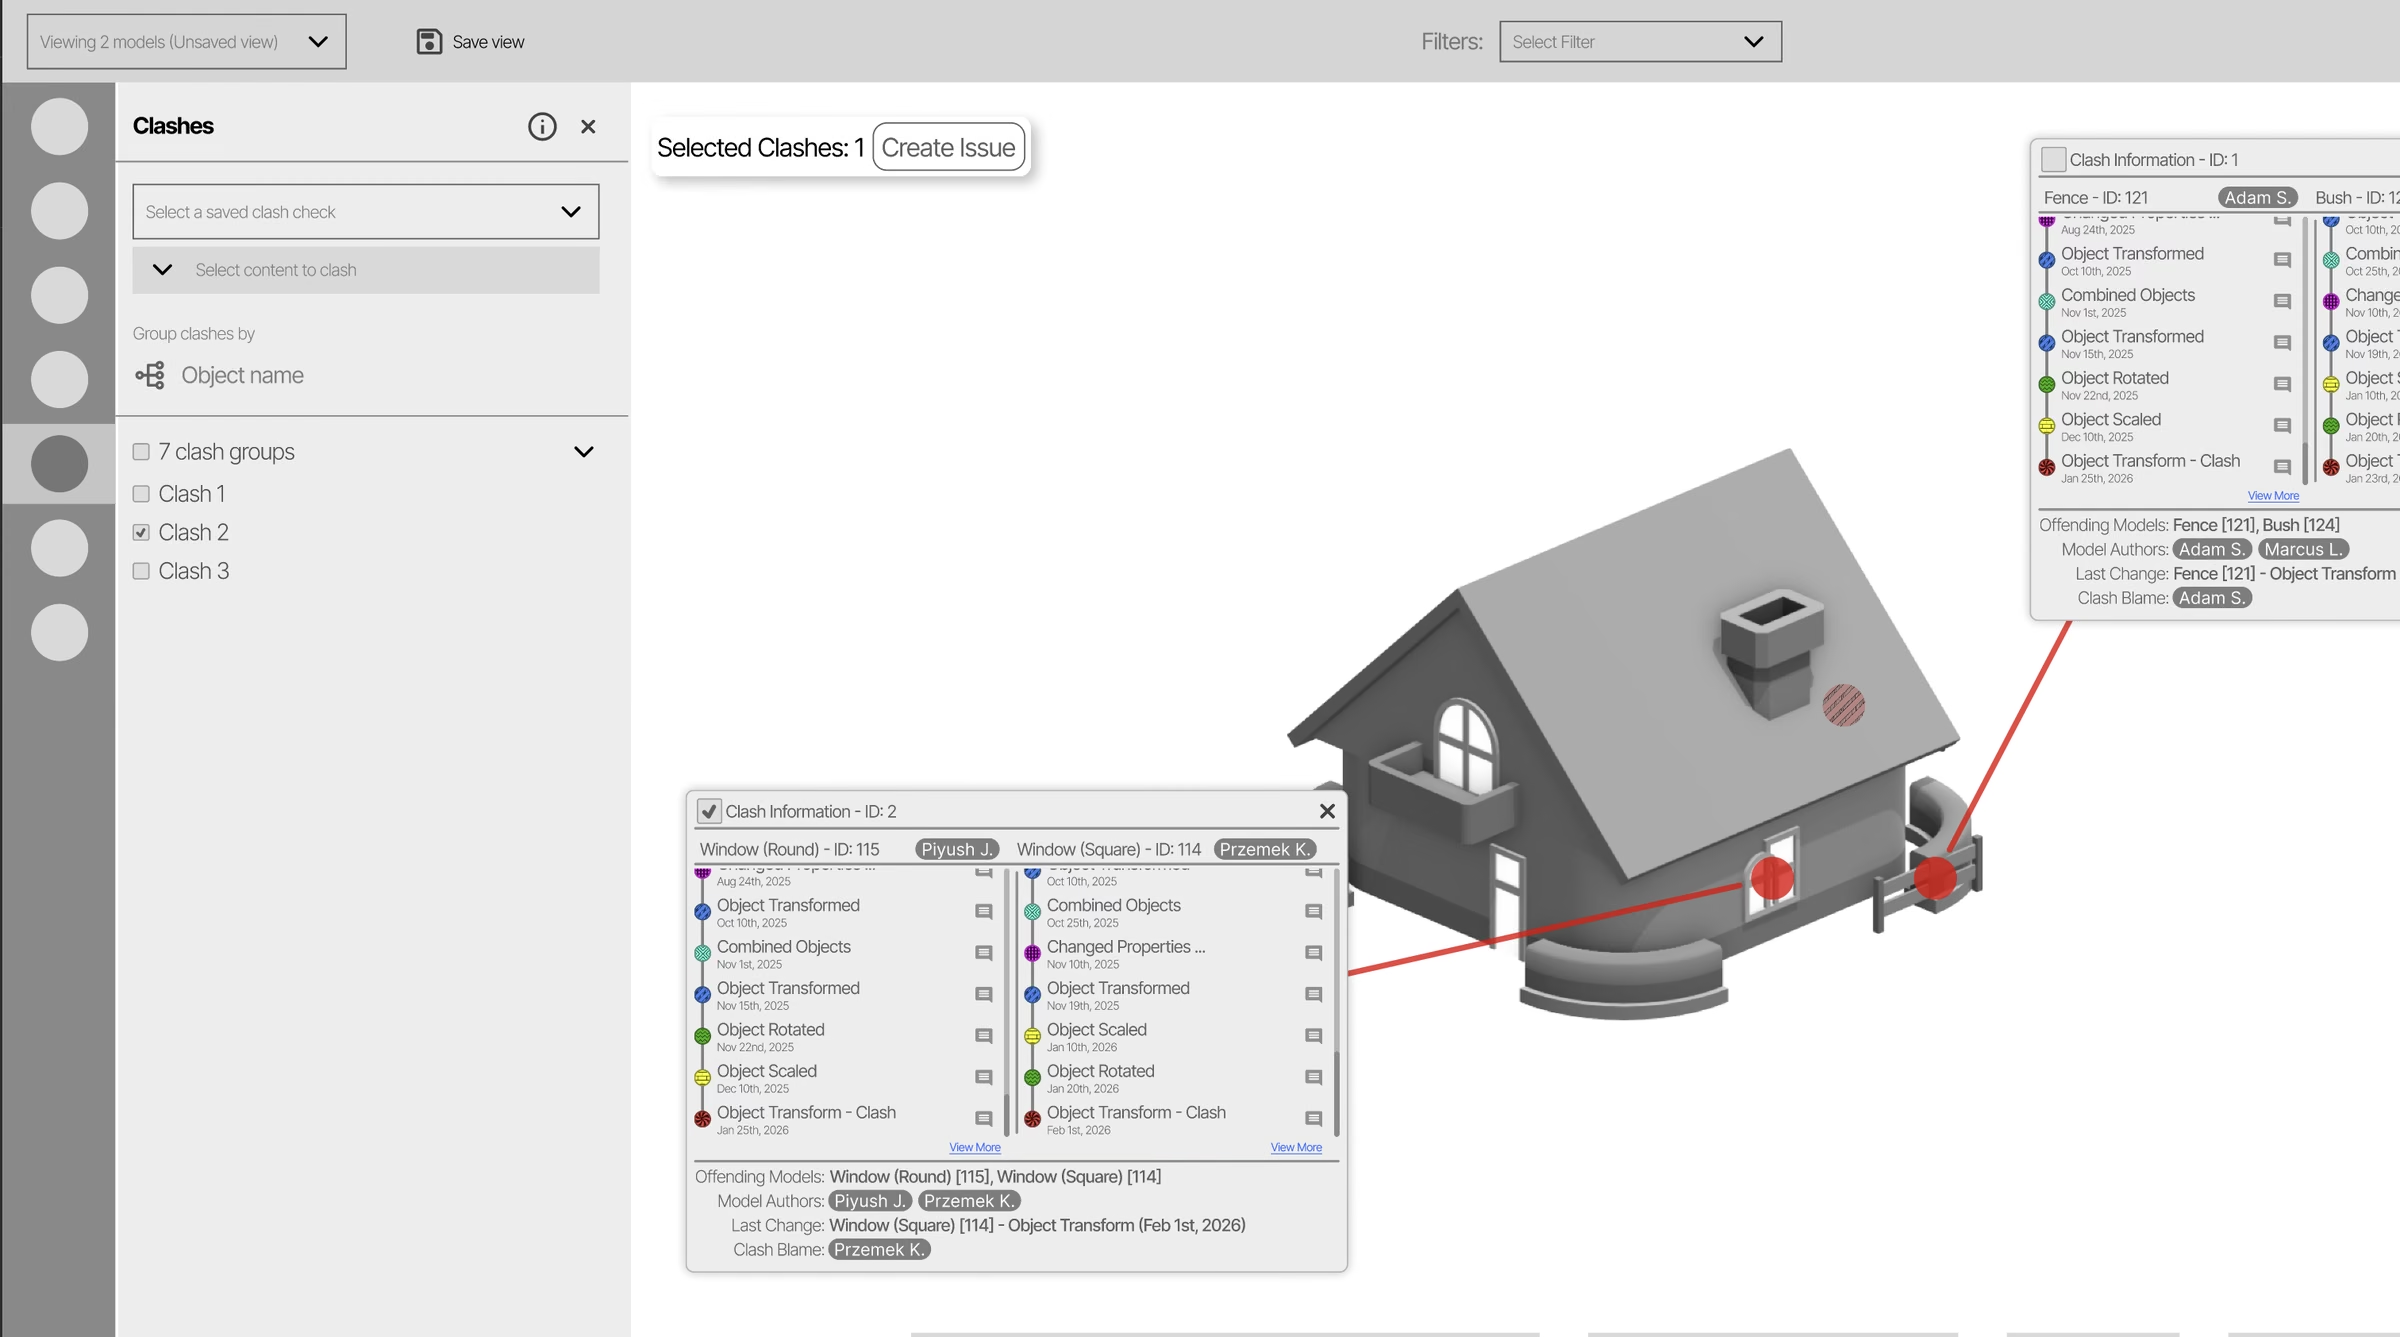
- Each object’s change timelineMoved, rotated, scaled or combined, with a date and space for comments on every change.
- The change that caused itEach timeline ends at the change that created the clash.
- Who to talk toThe models involved, who authored them, the last change, and who’s responsible for fixing it.
- Where it isEach card points to the clash in the 3D model.
- Turn it into workSelect clashes and create an issue in one step.
Tap a number to see what each part does.
Status and severity
Each clash also carries a status (New, Existing or Resolved) and a severity level, so teams can see at a glance what’s been dealt with and what’s urgent. The idea of a clear status came from the Navisworks benchmark.
06 · Decision 2
Let people cut the noise
- What we discovered
Clash review means scrolling through long, dense lists with little control over what you see.
- What we decided
Let people choose what to look at, instead of showing everything at once.
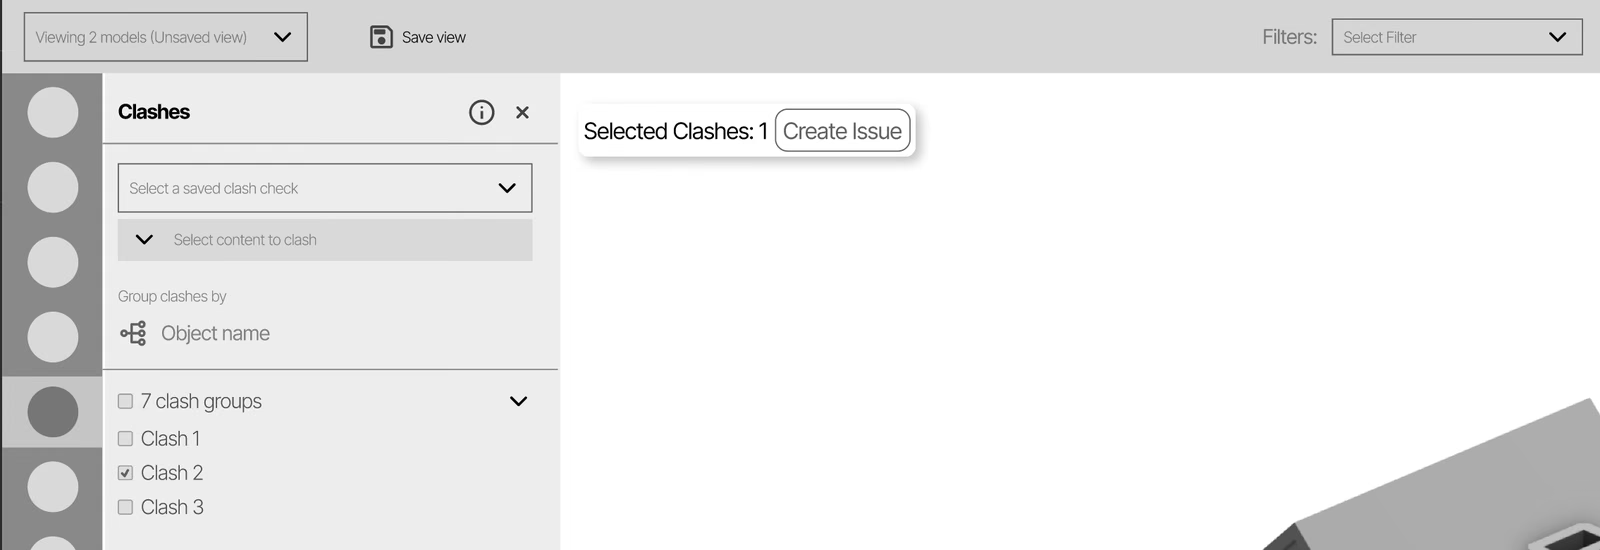
- What we designed
Clashes grouped by object, with filters for discipline, severity and type of model element. Each clash carries a discipline tag, so a team can find its own clashes quickly.
- Still open
This is design intent. We didn’t test it with people who review clashes for a living.
07 · Decision 3
Warn before it breaks
The brief asked how to bring two views together. Forecasting was our attempt to go one step further: from finding clashes after they happen to seeing them coming.
- What we discovered
Finding clashes late causes delays and rework.
- What I proposed
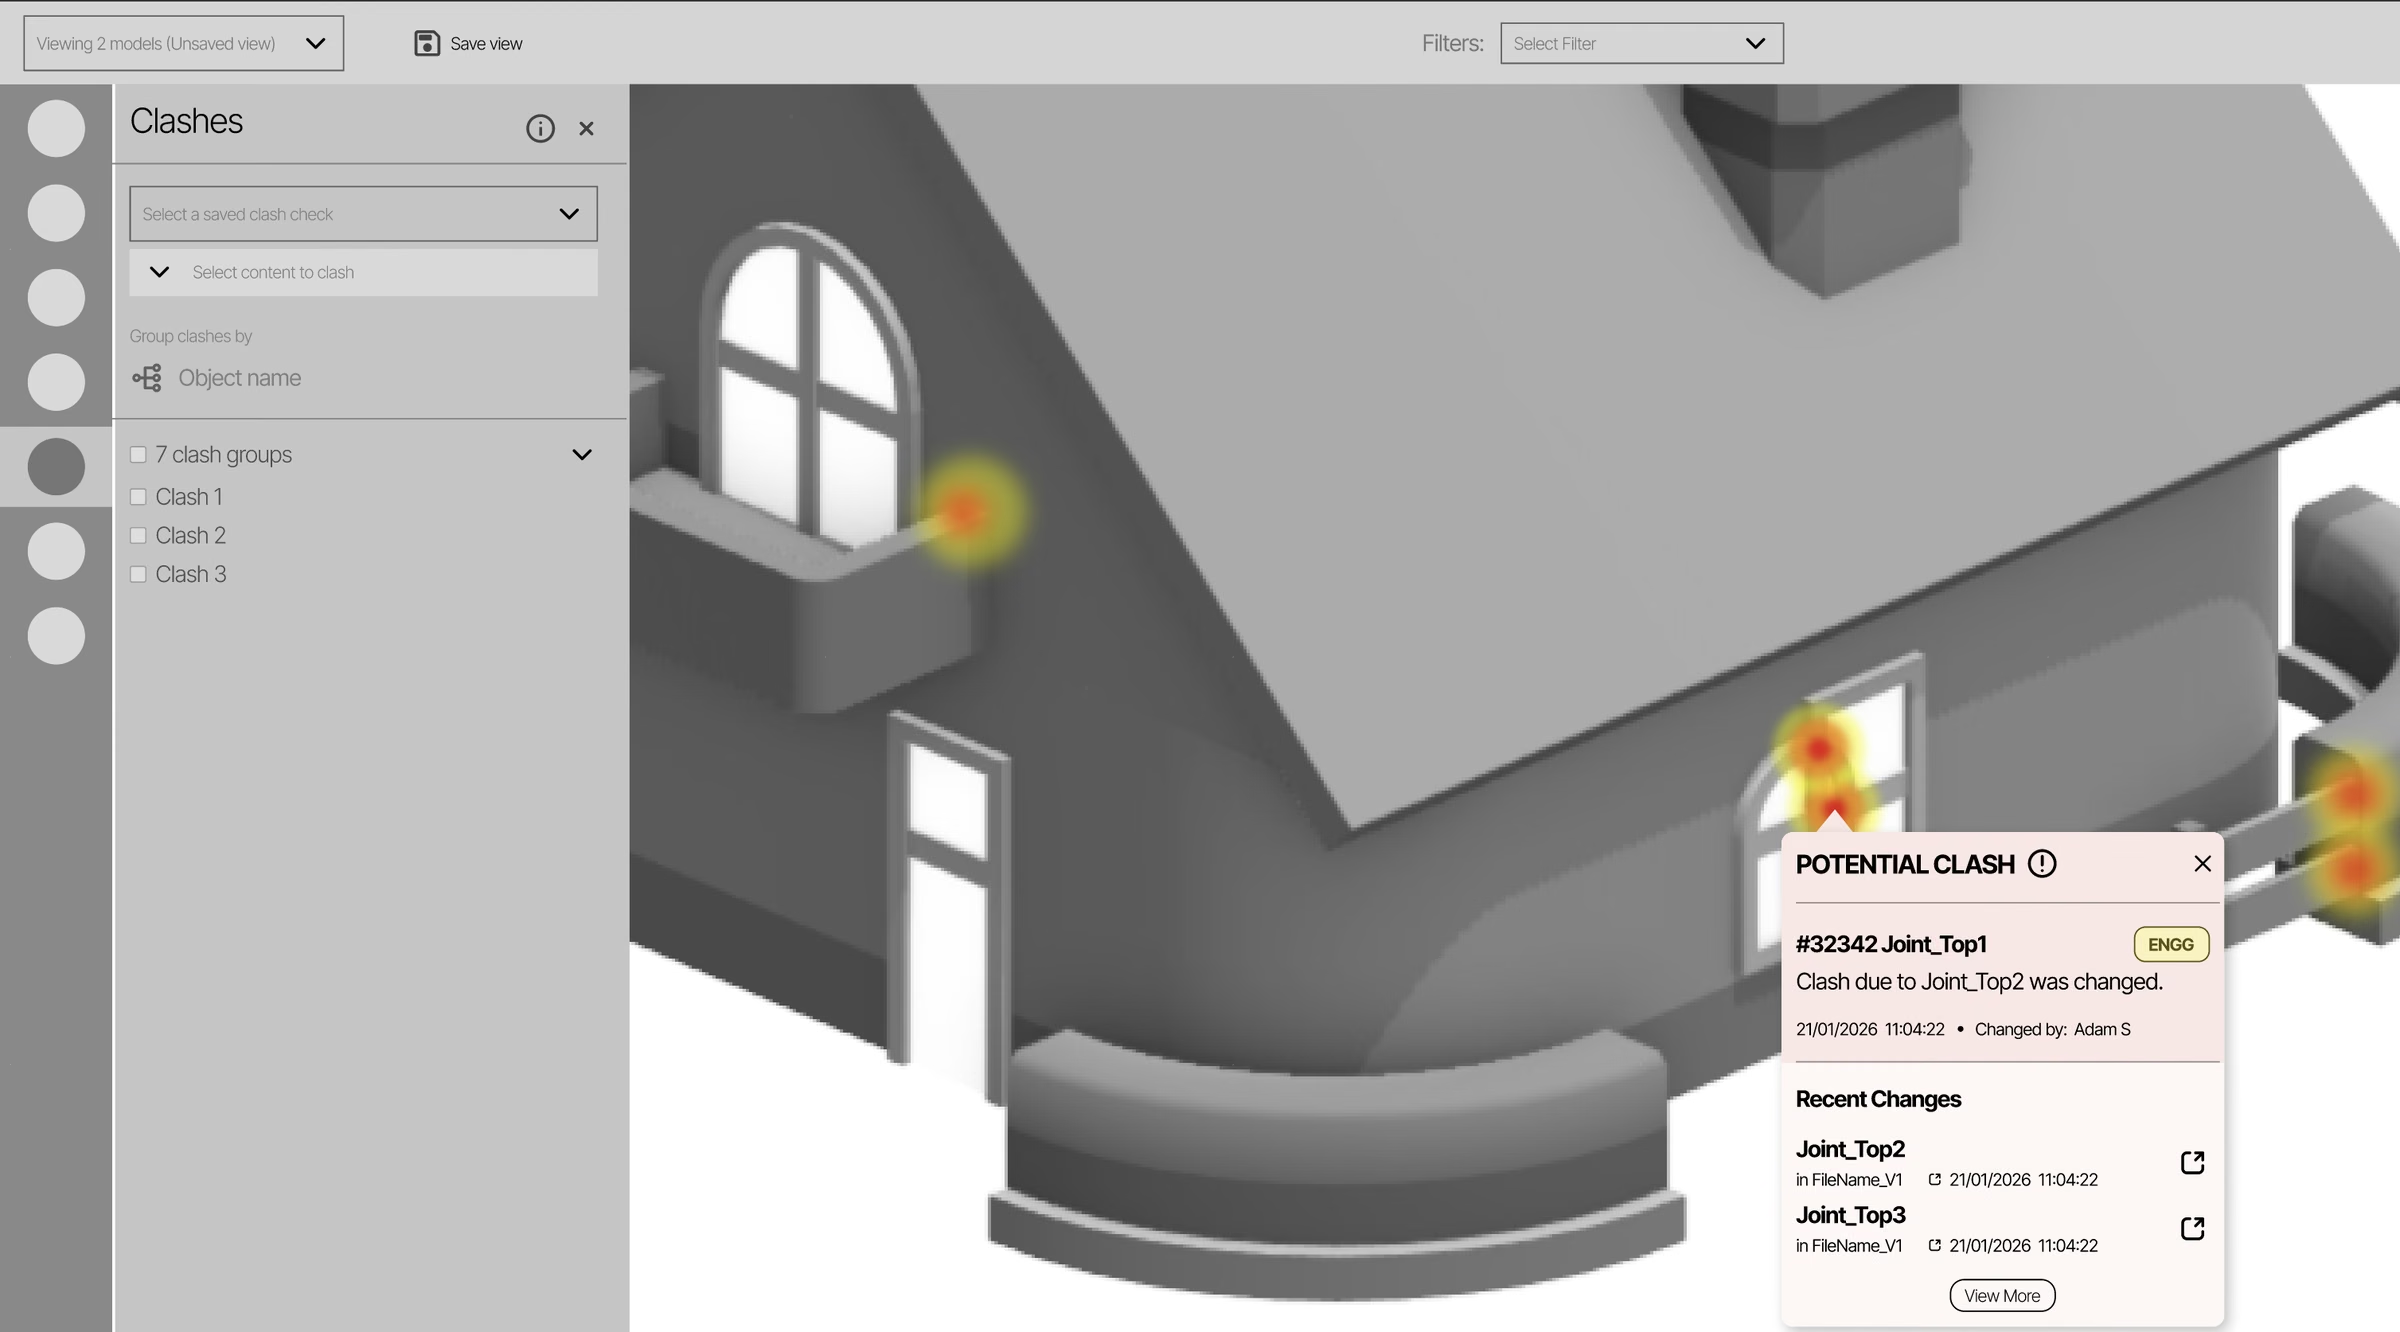
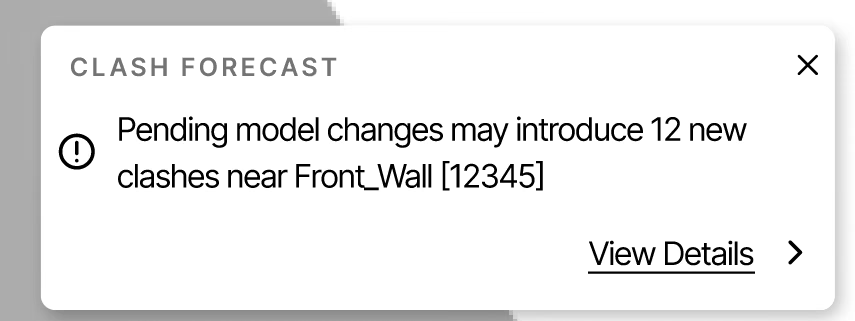
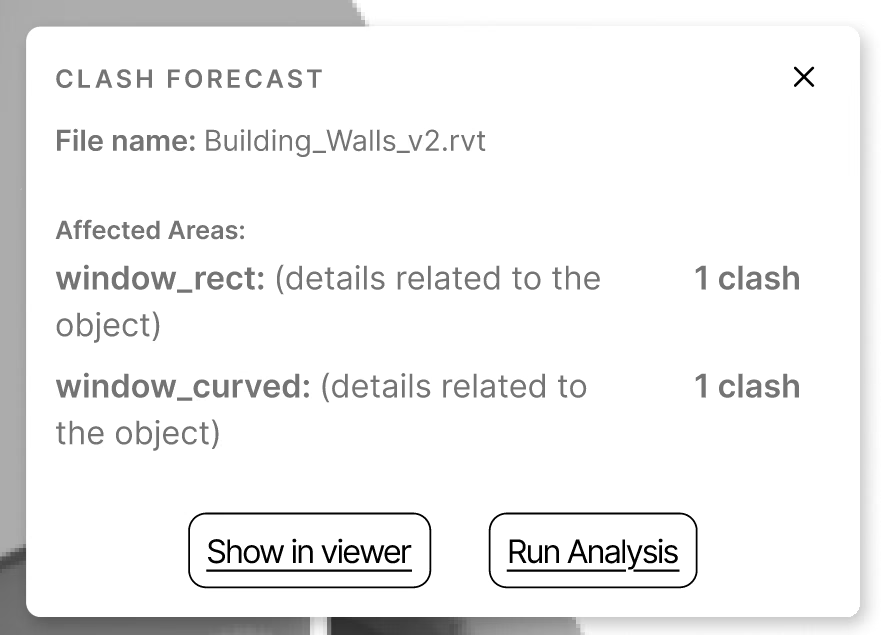
Use patterns in recent model changes to point out where clashes are likely, before anyone runs a full check.
- What we designed
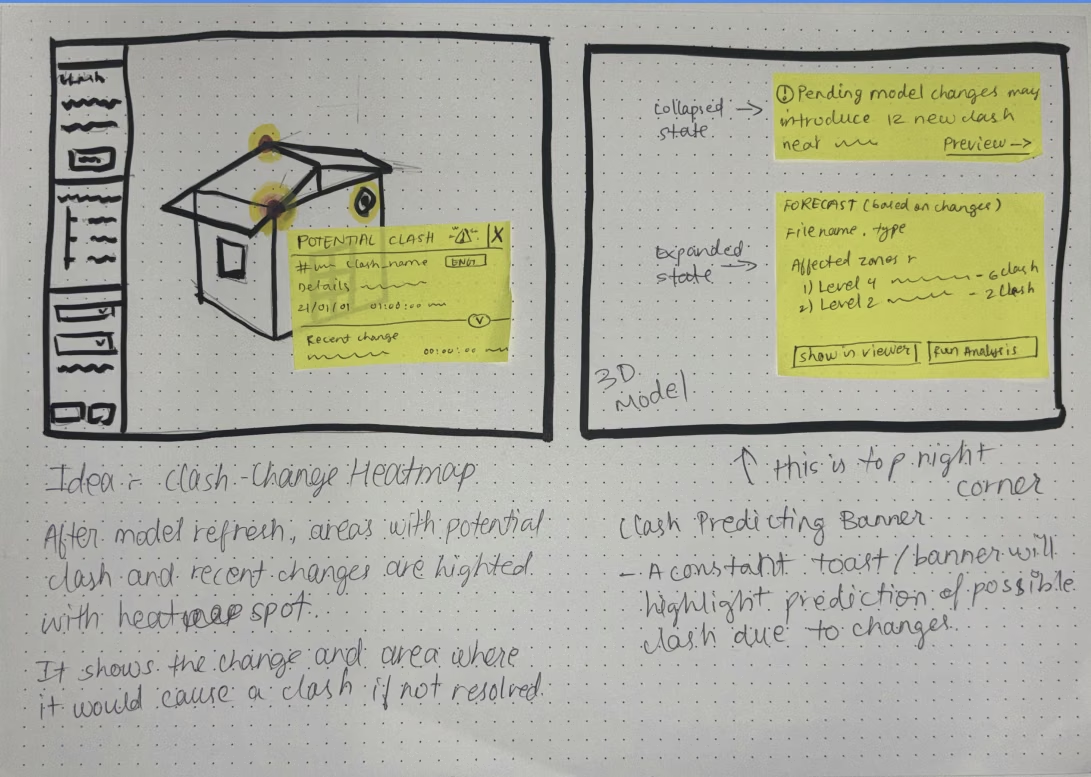
A heatmap of risky areas after each model refresh, and a banner that warns when pending changes may create new clashes.
- What we learned
The research showed late clashes are costly. It didn’t show they can be predicted. So this is an exploration, not a tested model.
08 · Putting it together
Tracing both ways
The core problem was that clash and change analysis weren’t connected. Together, the three decisions connect them in both directions.
- From a clash back to its change
The timeline inside each clash shows which change caused it and who made it.
- From a change forward to its clashes
The heatmap and forecast show where a change is likely to cause trouble.
- And to the right person
Filters and discipline tags show whose clash it is, so the user knows who to contact.
This is design intent. It hasn’t been tested with end users.
- Autodesk product stakeholders
We presented our design options and the reasoning behind them.
- A colleague who used to work at Autodesk
Gave formal, technical feedback on our ideas and background on how the tools are used. That’s expert input, not user testing.
09 · The team
Running a team of four
I led the team as well as designing. In practice that meant three things.
A task list for each person, stand-ups, and working sessions together.
I made sure everyone spoke in meetings with seniors and stakeholders, not just me.
I prepared the final presentation, so our research and design choices came across as one argument.
10 · Reflection
What this project taught me
- AI can narrow, but people have to judge
Without the AI first pass, 25,000 comments in six weeks wasn’t possible. But it made coding mistakes, so people made the final calls. The trade-off is that the first filter shaped what we saw.
- Going past the brief is worth it, if you’re honest about it
The brief asked how to join two views. Forecasting was our attempt at a different way of thinking: warn first instead of react later. It’s still an exploration, and the page says so.
- A benchmark can be a design anchor
The Navisworks status lifecycle gave us a pattern to learn from instead of inventing clash tracking from scratch.
- What’s unresolved
BIM Managers, Engineers and Architects need different things when they review clashes. Role-based views and permissions would need another sprint.
Public comments lean towards frustrated users. Power users and happy users barely appear.
Next: research with a mix of ACC users across disciplines and project types.
We never tested with real BIM Managers or Engineers. Expert feedback can’t replace that.
Next: a task-based usability study using the prototype on a real project.
ACC serves many disciplines with different priorities. Our findings may not apply to all of them.
Next: test forecasting against real clash and change history from live projects.
The full story has more detail than fits here, including the methods and the decisions behind them. Get in touch for a walkthrough.